Piloting the Imperial Shuttle

At staff meetings and the like, I often find myself channelling Princess Leia. The HoD, faculty head, or whoever will be outlining some pioneering new initiative, but what I’ll hear is General Madine announcing the theft of an Imperial shuttle to the assembled rebels in Return of the Jedi: “Disguised as a cargo ship, and using a secret Imperial code, a strike team will land on the moon and deactivate the shield generator.” To which I incredulously respond (usually - I hope! - to myself), “Who have they found to pull that off?!”

Well, finally - finally! - I get to be General Solo, and my strike team is assembled.

The hazardous, desperate, hare-brained, potentially glorious mission in question? Establishing an interdisciplinary curriculum to deliver to 5000+ second year undergraduate students here at the University of Sheffield. Specifically, I have taken on a part time secondment as an Academic Lead within our new cross-faculty programme, Achieve More, which aims to offer all of our undergraduates the chance to work collaboratively, across disciplines, to better understand some of the major challenges facing society - and how research can help to address these.

Various things attracted me to this post - and one should not underestimate the influence that turning 40 can have on major life decisions - but essentially, I applied because I think it is time to walk the walk of interdisciplinarity. Back in 2007, when I participated in NESTA’s Crucible programme (about which I have written before), I was already pretty sold on the idea the tools required to address global challenges would need to be draw from a range of different disciplines. At a Crucible reception, we heard the head of HEFCE commit to this interdisciplinary agenda, and subsequent funding initiatives in the environmental sector (e.g. Valuing Nature) have backed up this commitment to a certain extent.

But something else they got us to do on Crucible was to design the ‘University of Utopia’ - given a blank slate, how would we go about designing a university? Our plans differed in details - things such as establishing fast lanes so that academics can walk briskly between buildings unimpeded by loitering students, as I recall - but one common thread was that none of us went for a departmental structure. Put simply, if you start from the perspective of questions or challenges - ‘food security’ would be a good example - then it makes little sense to sit all the plant scientists in one building, apart from all the political scientists, historians, chemists, and so on.

And yet, universities are the way they are - to some extent, the way they have always been - and departments are not going away. Initiatives like Achieve More, then, are intended to bring us that bit closer to Utopia. It is no surprise that we are not alone in thinking this way - indeed, I would suggest there is a general trend across the UK higher education sector to offer students broader opportunities, in addition to the depth of disciplinary knowledge that has always HE’s primary selling point. Both Exeter and UCL, to pick a couple of examples, have programmes allowing students to engage with research with a focus on major societal challenges.

In part this is a recruitment tool, sold on employability. For instance, I recently heard digital health entrepreneur Kieran Daly say that businesses such as those he supports are looking to hire T-shaped people - graduates with a breadth of knowledge across disciplines, as well as a depth of knowledge within their core subject. How widely-held this preference is among employers remains to be seen, but certainly some of the key qualities we are seeking to instil - effective teamwork, good communication skills, a range of critical thinking skills, and so on - ought to look good on any CV.

More generally, however, this shift towards a more holistic view of what higher education should deliver can be thought of as an attempt to re-establish the idea of ‘scholarship’ in a 21st Century context. Some existing programmes seem focused much more on enriching the undergraduate experience than on ticking ‘employability’ boxes - see the Broad Vision programme at the University of Westminster, for example, which gets artists and scientists involved in creative conversations and collaborative projects. This chimes really well with my own experiences on Crucible and elsewhere: above all, working outside the comfort zone of your own discipline - especially when you are given the freedom to fail, to talk and collaborate and create but ultimately to come up with nothing functional - ought to be fun.

All very well in theory, then; but the devil, of course, is in the logistics. What separates Achieve More from programmes at other institutions is the scale of its ambition - we want all our students want to participate, not just a highly motivated, self-selected few. Which means that conversations with colleagues typically start with ‘That’s a great idea BUT…’ Better, of course, than ‘That’s a terrible idea AND…’ But the ‘BUT’ is big. And addressing that is what will be keeping me busy for a while.

So if you’ll excuse me, people are relying on me to get that shield down. I just need more time…

Science, Gender, and the Social Network

Some while ago, preparing a piece for the British Ecological Society’s Bulletin on the general scarcity of female ecology professors, we had the pleasure of interviewing Professor Anne Glover. (Shortly afterwards Anne went on to become EU Chief Scientist. Coincidence? You decide…) One of the things that Anne talked to us about was the importance of informal social networks in career progression within science. Business conducted after hours, over drinks. Basically Bigwig A asking Bigwig B if he (inevitably) could think of anyone suitable for this new high level committee, or that new editorial board; Bigwig B responding that he knew just the chap. That kind of thing. In some ways this is one of the less tractable parts of the whole gender in science thing. Much harder to confront, in many ways, than the outright and unashamed misogyny of the likes of Tim Hunt, simply because it is so much harder to pin down. We know that all male panels in conferences, for instance, are rarely the result of conscious discrimination, more often stemming from thoughtlessness, laziness, or more implicit bias.

With something as public as a conference, of course, then we can easily point out such imbalances, and smart conference organisers can take steps to avoid them. (My strategy, by the way, is to identify the top names in your field, and invite members of their research groups. Has worked wonders for workshops I have run.) But how to get more diversity out of those those agreements made over a pint (or post-pint, at the urinals)?

One way is to take steps to help a wide range of early career scientists to raise their profile. Be nice to them online, invite them to give talks, promote their papers, and so on. But another way into prominence is through publishing. Not your own papers (though that helps, of course); but the process of publishing others. Get a reputation for reviewing manuscripts well, and invitations onto editorial boards will follow. From their, editorial board meetings and socials, and your name starts to gain currency among influential people.

All of which is fine, but peer review is an invitation-only club. If you’re not invited, you’re not coming in.

Which brings me to the point of this post. I’m on a couple of editorial boards - Journal of Animal Ecology and Biology Letters. As a handling editor, I am responsible, among other things, for inviting referees to review manuscripts. And when I do this, you can bet your life that I will be calling on those potential reviewers nominated by the authors. Not exclusively, but certainly they will figure.

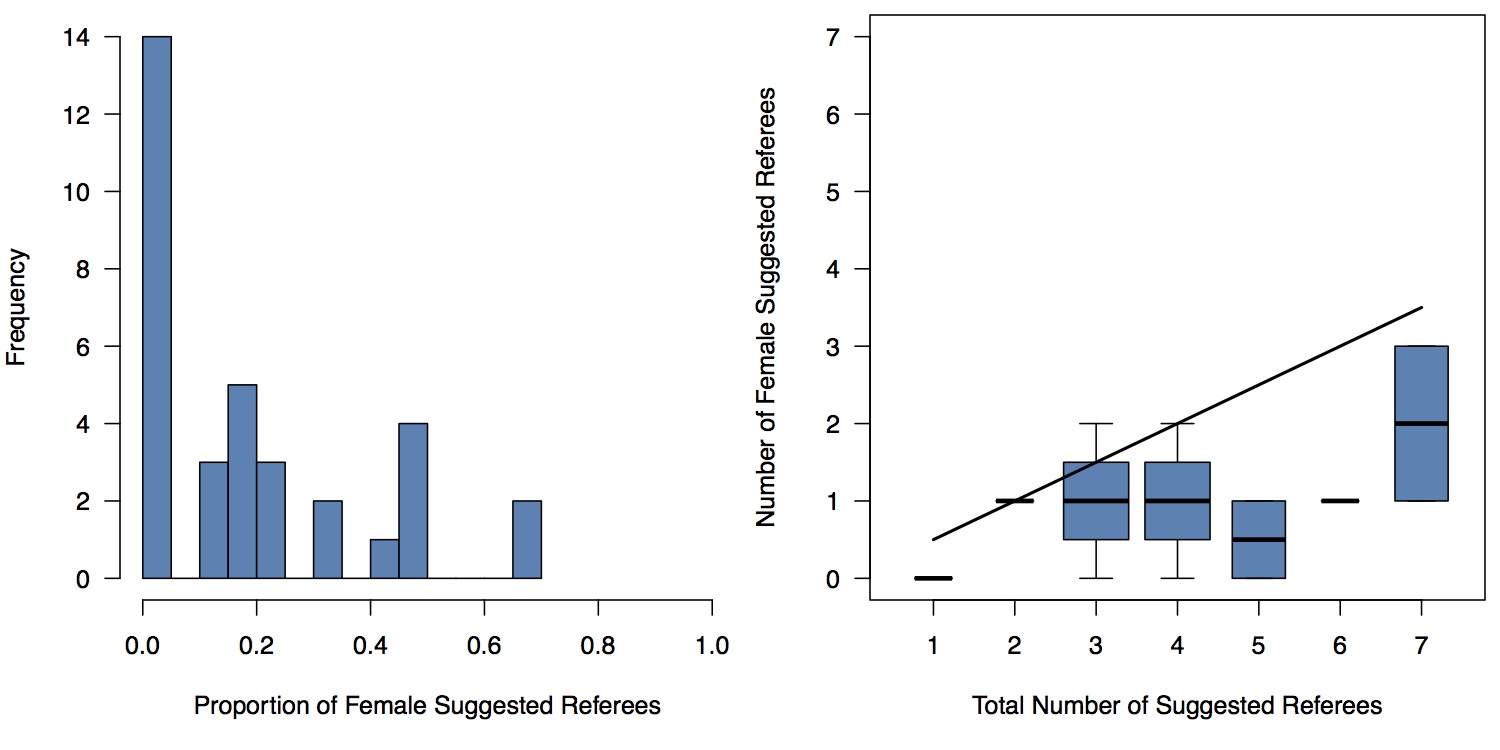
And I started to wonder what kind of gender balance there might be among these suggestions. 34 papers in, here’s your answer. (I should stress that the identity of the journals has no bearing on the following, all statistics are purely the result of choices made by submitting authors.) Over 40% of submitting authors did not suggest any female referees, with female suggested referees exceeding males on only 2 occasions, and a median proportion of 15% female suggestions. The number of suggested female referees does not increase with the total number of referees suggested, neither is there any relationship between the proportion of female authors (median in this sample of 1/3) and proportion of female suggested referees (correlation of 0.05, if you want numbers). Here’s a couple of figures:

Frequency distribution of the proportion of female suggested reviewers from 34 paper (left), and the number of female reviewers against the total number of suggested reviewers (right), where the diagonal line indicates parity.


What’s the message here? Maybe we need to start thinking more carefully about lists of names we come up with, not just when these choices will be public - speakers at a conference for example; but also - perhaps especially - when they will not. And not just because of benefits that reviewers may or may not eventually receive in terms of board membership and so on. We get quickly jaded about the whole process of reviewing manuscripts, and forget too soon what a confidence boost it can be to be asked.

And just a coda: I’ve been thinking about this blog post for some time, a year at least. What is depressing is the number of occasions over that year - Hunt’s ridiculous outburst merely the most recent - when I have thought ‘I must get that post written, it’s so topical right now.’ How many years since Anne Glover outlined all these issues to us? (Eight, and counting.) How much has actually changed?

Well, one thing has, at least - the rise of new social networks, the online community that can be cruel but can also be incredibly supportive, providing a voice for those whom certain public figures would prefer to remain mute. These networks are open, no longer dependent - thank goodness - on 1950s values, beer-fuelled patronage, and old school ties.

Cricket averages: what do you mean?

Easter has always seemed a nothing sort of a holiday to me. Partly it’s because I never know when it will be (I would vote for a party that pledged to standardise Easter, but that’s another matter…) There is - of course - an R function, timeDate::Easter(), but Easter’s date will never be ingrained in the way that Christmas is, and thus anticipation will never build to the same extent. There’s not much to look forward too, either. Don’t get me wrong, I quite like chocolate; which is why I eat it whenever I feel like it, regardless of the time of year. And even when I was a pious little church-going boy, I could never actually get excited about Easter. But the end of the Easter holidays? Well, that was a different matter. Summer term meant many things - ties became optional, blazers were off most of the time, and the daily school bus ride was less of a trudge when the sun was out. The main thing, however, was the neat, flat, freshly mowed square of grass waiting for us in the middle of the playing field which meant one thing: cricket. For a few years I lived for cricket, and would play at every opportunity. And when I couldn’t play - when it was raining, or dark, or winter - I would pore over back issues of Wisden Cricket Monthly, soaking up the hallowed stats.

I guess many kids - I don’t want to fall in to gender stereotypes, but I could probably have written ‘many boys’ there without too much controversy - are introduced into quantitative thinking through a fixation with sports statistics. And cricket is great for stats - I’m not sure we have a dedicated R book yet in the way baseball does, but a game so slow and intricate, with so many things to measure and count, has spawned a wealth of stats, now fully searchable through interfaces such as cricinfo’s statsguru. Thus, more or less any notable feat in a cricket match is some kind of record - the highest score by an English wicketkeeper batting at number 7 in the 3rd innings of a test match against Pakistan at Headlingly, and so on. As a kid I lapped all this up, and most numbers up to 501 (Brian Lara’s record for the highest first class score) have some cricketing resonance for me.

As my quantitative skills became more sophisticated, however, I began to realise that what are called ‘stats’ in sport are usually just data, there to be arranged, cherry picked, or otherwise massaged to tell whichever story suits a particular commentator’s overriding narrative. Furthermore, I started to question the gold standard by which cricketers are remembered - their ‘average’. For batsmen, this is the mean number of runs they have scored per completed innings; for bowlers the mean number of runs conceded per wicket. And these are the numbers most keenly studied by students of the game, used to judge one player against another, or to assess the vagaries of form of an individual player over the course of his career.

There are a number of reasons to dislike the naive arithmetic mean, even in situations where it is a good measure of central tendency. For instance, designing public transport to be comfortable for people of average height leaves the half of the population (that into which I fit…) generally uncomfortable. But how useful is it in judging a player’s performance? Well, it depends what you want to know.

Let’s take the most famous average in cricket, 99.94 (you’ll note the precision; cricket nerds love precision). That was the average that Don Bradman ended his test career with - famously finishing in his 80th innings with a duck (0) against England at The Oval when a score of just 4 would have secured a career average of 100. Bradman’s average is the most freakish of outliers - no other batsman who has batted 20 or more times has averaged higher than 65, with 50 typically considered the halmark of an exceptional player - but a look at his figures still serves to illustrate some points.

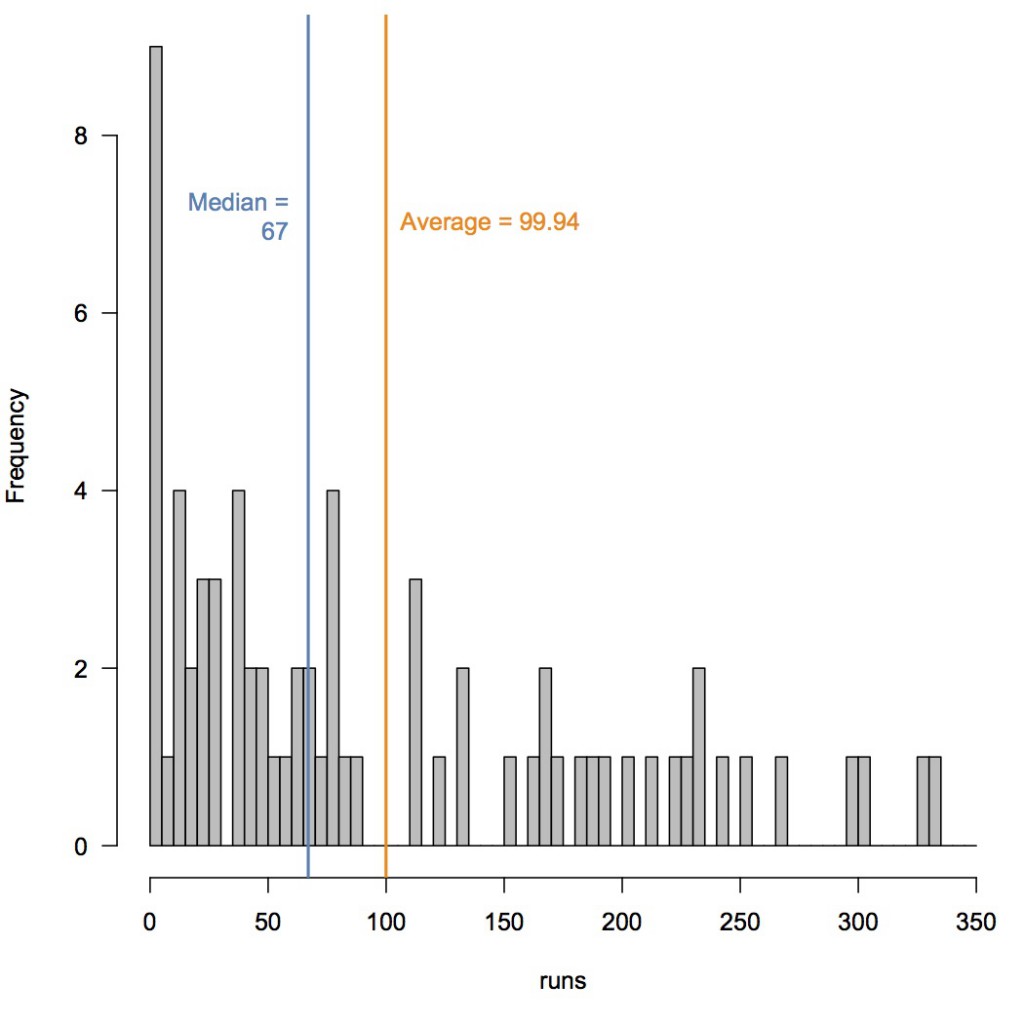
Don Bradman's 70 completed innings (the 10 innings he finished Not Out are added to the subsequent completed innings). Dats from http://www.espncricinfo.com/australia/content/player/4188.html

First, you can see that the distribution of Bradman’s scores is highly skewed. This makes complete intuitive sense - batsmen are always vulnerable early in their innings (lots of low scores, including seven scores of 0), but once they get ‘in’ the best batsmen capitalise with a big score. Few if any did this better than Bradman - he passed fifty 42 times, converting 29 of these to scores of 100 or more, 18 of which were what the kids these days call ‘daddy hundreds’ (>150), two thirds of these eventually ending over 200 (ten double hundreds and two triples).

But what is also clear is that Bradman hardly ever scored anything close to his average. Only three times did he finish with a score within 5 runs of 99.94 - two scores of 103, one of 102. He was not dismissed in two of these innings, so in my plot they are added to the next completed innings - which, as it happens, includes in one case the third such innings. So, there’s a noticable hole in the frequency distribution of completed innings between scores of 89 and 111, exactly where the average lies. Bradman’s average, then, is a really poor indicator of his likely score in any particular innings - he was far more likely to score 0, or 225 (±10), than 100.

What might we do as an alternative? Bradman’s median score is the far less romantic 67, something he scored close to (±10 runs) about 10% of the time. His geometric mean score (problematically removing the problematic 0s) is 45.23, which again he was close to once every ten innings. Maybe we should cite too a measure of variability - the standard deviation, say, which is 94.17, or the median absolute deviation of 80.06.

All of this though misses the point, which is that Bradman’s average tells us one thing loud and clear: he was an astonishingly good batsman. And while we might want to make some distinctions between players from different eras, or in different forms of the game, for broad comparisons the average serves pretty well. It seems silly to read too much into the decimal places - was Alan Border, with a career average of 50.56, demonstrably better than my childhood hero Viv Richards (50.23)? Of course not. Occasionally, too, you’ll get a Jason Gillespie event - a player with a career average of 18 scoring a double hundred - just as Bradman got his ducks. So on an innings by innings basis, the average might not be useful, but over the course of a year or two scores will tend to, well, average out. Does an average of 42.35 then indicate a stronger batsman, likely to score more heavily than one averaging 10.74? Even when applying the arithmetic mean to a horribly skewed distribution? Well yes, I think it does.

(Oh, and if you wondered which players have averages of 42.35 and 10.74, well, they’re on the same team, but the data aren’t from cricinfo…)